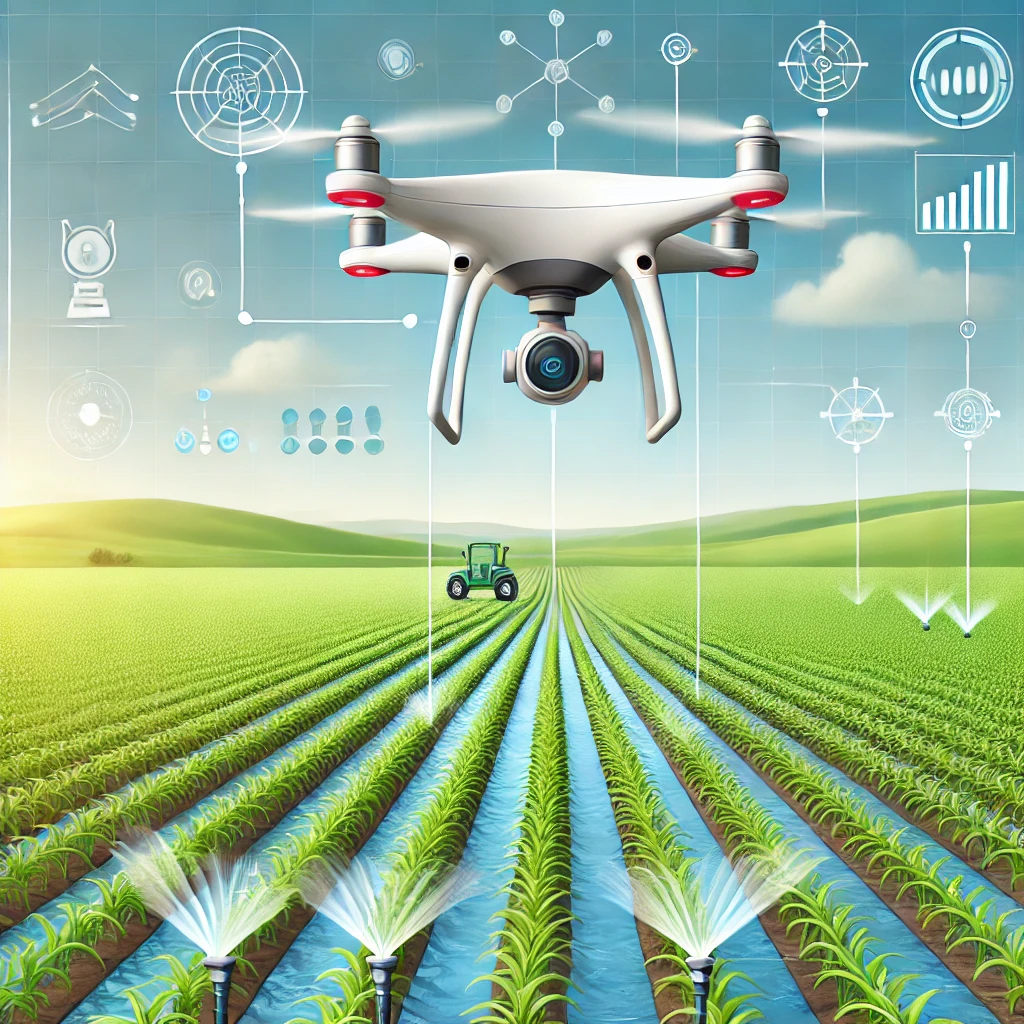
Using unmanned aircraft, we capture multispectral imagery which is then analyzed using vegetation indices to assess crop health, identify stress factors, and optimize inputs.
-
Multispectral Sensors: Capture data in several specific wavelengths of light, typically including red, green, blue, near-infrared (NIR), and sometimes red-edge bands.
Hyperspectral Sensors: Capture data in hundreds of narrow spectral bands, allowing for highly detailed analysis but typically at a higher cost.
Thermal Sensors: Measure surface temperature, which can indicate water stress or disease.
High-Resolution RGB Cameras: Useful for visual inspection and creating orthomosaics.
LiDAR: Measures plant height, canopy structure, and biomass.
-
Drones are programmed to fly predetermined routes over fields, capturing overlapping imagery for stitching into orthomosaic maps.
Depending on the sensor, data may include spectral reflectance values, thermal readings, and elevation information.
Flights are conducted during optimal conditions (clear skies, minimal wind) to ensure data quality.
-
NDVI (Normalized Difference Vegetation Index)
Formula: NDVI=(NIR−Red)(NIR+Red)NDVI = \frac{(NIR - Red)}{(NIR + Red)}NDVI=(NIR+Red)(NIR−Red)
Purpose: Measures plant vigor and biomass.
Interpretation: Values range from -1 to 1, with higher values indicating healthier vegetation.
EVI (Enhanced Vegetation Index)
Formula: EVI=2.5⋅(NIR−Red)(NIR+6⋅Red−7.5⋅Blue+1)EVI = 2.5 \cdot \frac{(NIR - Red)}{(NIR + 6 \cdot Red - 7.5 \cdot Blue + 1)}EVI=2.5⋅(NIR+6⋅Red−7.5⋅Blue+1)(NIR−Red)
Purpose: Reduces atmospheric interference and enhances sensitivity in areas with dense vegetation.
Interpretation: Better suited for areas with high biomass.
NDRE (Normalized Difference Red Edge)
Formula: NDRE=(NIR−RedEdge)(NIR+RedEdge)NDRE = \frac{(NIR - RedEdge)}{(NIR + RedEdge)}NDRE=(NIR+RedEdge)(NIR−RedEdge)
Purpose: Detects stress in mature crops by using the red-edge band.
Interpretation: Useful for identifying subtle changes in chlorophyll content.
GNDVI (Green Normalized Difference Vegetation Index)
Formula: GNDVI=(NIR−Green)(NIR+Green)GNDVI = \frac{(NIR - Green)}{(NIR + Green)}GNDVI=(NIR+Green)(NIR−Green)
Purpose: Measures chlorophyll content and plant stress, particularly water stress.
Interpretation: An alternative to NDVI that incorporates the green band for improved sensitivity to leaf health.
SAVI (Soil-Adjusted Vegetation Index)
Formula: SAVI=(NIR−Red)(NIR+Red+L)⋅(1+L)SAVI = \frac{(NIR - Red)}{(NIR + Red + L)} \cdot (1 + L)SAVI=(NIR+Red+L)(NIR−Red)⋅(1+L)
Purpose: Minimizes soil background effects in sparse vegetation.
Interpretation: Includes an adjustment factor (L) for better accuracy in low vegetation cover areas.

Crop Health Monitoring with Drones
Drones equipped with multispectral sensors are invaluable tools for monitoring crop health.
Sensors capture data in specific bands of the electromagnetic spectrum.
By analyzing these spectral bands, we detect stress factors, and optimize inputs like water, nutrients, and pesticides.
Multispectral Sensors: Capture data in several specific wavelengths of light, typically including red, green, blue, near-infrared (NIR), and sometimes red-edge bands.
Hyperspectral Sensors: Capture data in hundreds of narrow spectral bands, allowing for highly detailed analysis but typically at a higher cost.
Thermal Sensors: Measure surface temperature, which can indicate water stress or disease.
High-Resolution RGB Cameras: Useful for visual inspection and creating orthomosaics.
Vegetation Indices
Vegetation indices (V.I.) measure values from specific wavelengths (e.g., red and near-infrared).
Variations in reflected light from plants highlight differences in health that are invisible to the naked eye.
How Vegetation Indices Work
Healthy vegetation absorbs most visible light (especially red) for photosynthesis and reflects a large portion of near-infrared light.
Stressed vegetation reflects more red light and less NIR light due to reduced chlorophyll content and cellular structure changes.
By analyzing these reflectance patterns, vegetation indices can provide insights into:
Photosynthetic activity
Chlorophyll content
Plant water content
Biomass and growth stage
Early signs of stress (e.g., pests, disease, drought)
Contact us.
contact@ncdroneco.com
(828) 289-0217


